
The North East Topped Every Table in England This Week. The Average Is Still Lying to You.

The North East just posted the highest house price growth of any English region and joint-highest rent growth in the country, the kind of headline every property page in the country will run this week. It's also, on its own, the least useful number in the release. Land Registry's local authority data, published the same day as the ONS bulletin, shows growth across the corridor ranging from 3.0% in Stockton-on-Tees to 7.3% in Northumberland, more than double, inside that single 4.9% regional average. None of the nine local authorities from Blyth to Middlesbrough actually grew at the rate the headline reports. This piece breaks down what the numbers really show, place by place, and what that means for underwriting the next deal rather than the last headline.
ONS published its September release on 16 September. Nationally, house prices grew 1.4% and rents grew 3.8%, the two lines moving in opposite directions. Buried in the same release: the North East had the highest house price growth of any English region at 4.9%, accelerating from 4.0% the month before, and joint-highest rent growth at 5.8%, actually down from 6.3%, while still carrying the lowest average rent in the country at £788 a month. That is the headline most people will stop at. The number underneath it is more useful. Land Registry's local authority breakdown, published the same day, shows growth across the corridor running from 3.0% in Stockton-on-Tees to 7.3% in Northumberland, more than double, inside a single regional average of 4.9%. If you are underwriting off the regional number, you are underwriting off a blend of markets that are not having the same year.
Two lines moving apart, and a region hiding in plain sight
ONS's Private Rent and House Prices bulletin for September, released 16 September, gives you the national picture in two figures. Average UK house prices rose 1.4% to £273,000 in the twelve months to July, down from 1.5% the month before. Average UK private rents rose 3.8% to £1,400 in the twelve months to August, up from 3.7% the month before. Prices are losing pace. Rents are not. That gap is the story most of the property press will run this week, and it is a real one, but it is also a national average, and national averages are where the interesting detail goes to die.
Read past the headline and the same bulletin puts one region top of both tables. The North East had the highest house price growth of any English region, at 4.9% in the twelve months to July, up from 4.0% the month before. It shares the highest rent growth in the country with the North West, both at 5.8% in the twelve months to August. London, by contrast, is in its eleventh straight month of falling prices, down 3.3%, average price £569,000, nineteen thousand pounds below its July 2025 peak.
Put plainly: while the national conversation is about prices stalling, the region we operate in has the highest annual house price inflation of any English region, and its rate has accelerated from 4.0% to 4.9%. That is not a small fact to have sitting one paragraph below the fold of a national release.
Look more closely, though, and the region's own two numbers are not telling the same story as each other. House price growth is speeding up, 4.0% to 4.9% in a single month. Rent growth, while still the joint-highest in the country, is actually easing, 6.3% to 5.8% over the same window. That is not universal even in the direction of travel: the North West also rose slightly, 5.7% to 5.8%, London rose from 3.0% to 3.5%, and the South East rose from 2.9% to 3.0%, so several regions moved up even as the North East eased back. So even inside the "North East is winning on both fronts" headline, one front is accelerating and the other is decelerating from a higher base, in company with some regions and not others. That is the first sign that a single regional number, even a genuinely strong one, is compressing two different trends into one figure. It will not be the last.
The number that should worry you if you only read the first one
Here is the part that matters more than the 4.9%. HM Land Registry published its local authority breakdown on the same day, 16 September, covering the same twelve months to July 2026. The regional figure of 4.9% is an average across the whole of the North East. It is not what happened in any specific place. What actually happened, local authority by local authority:
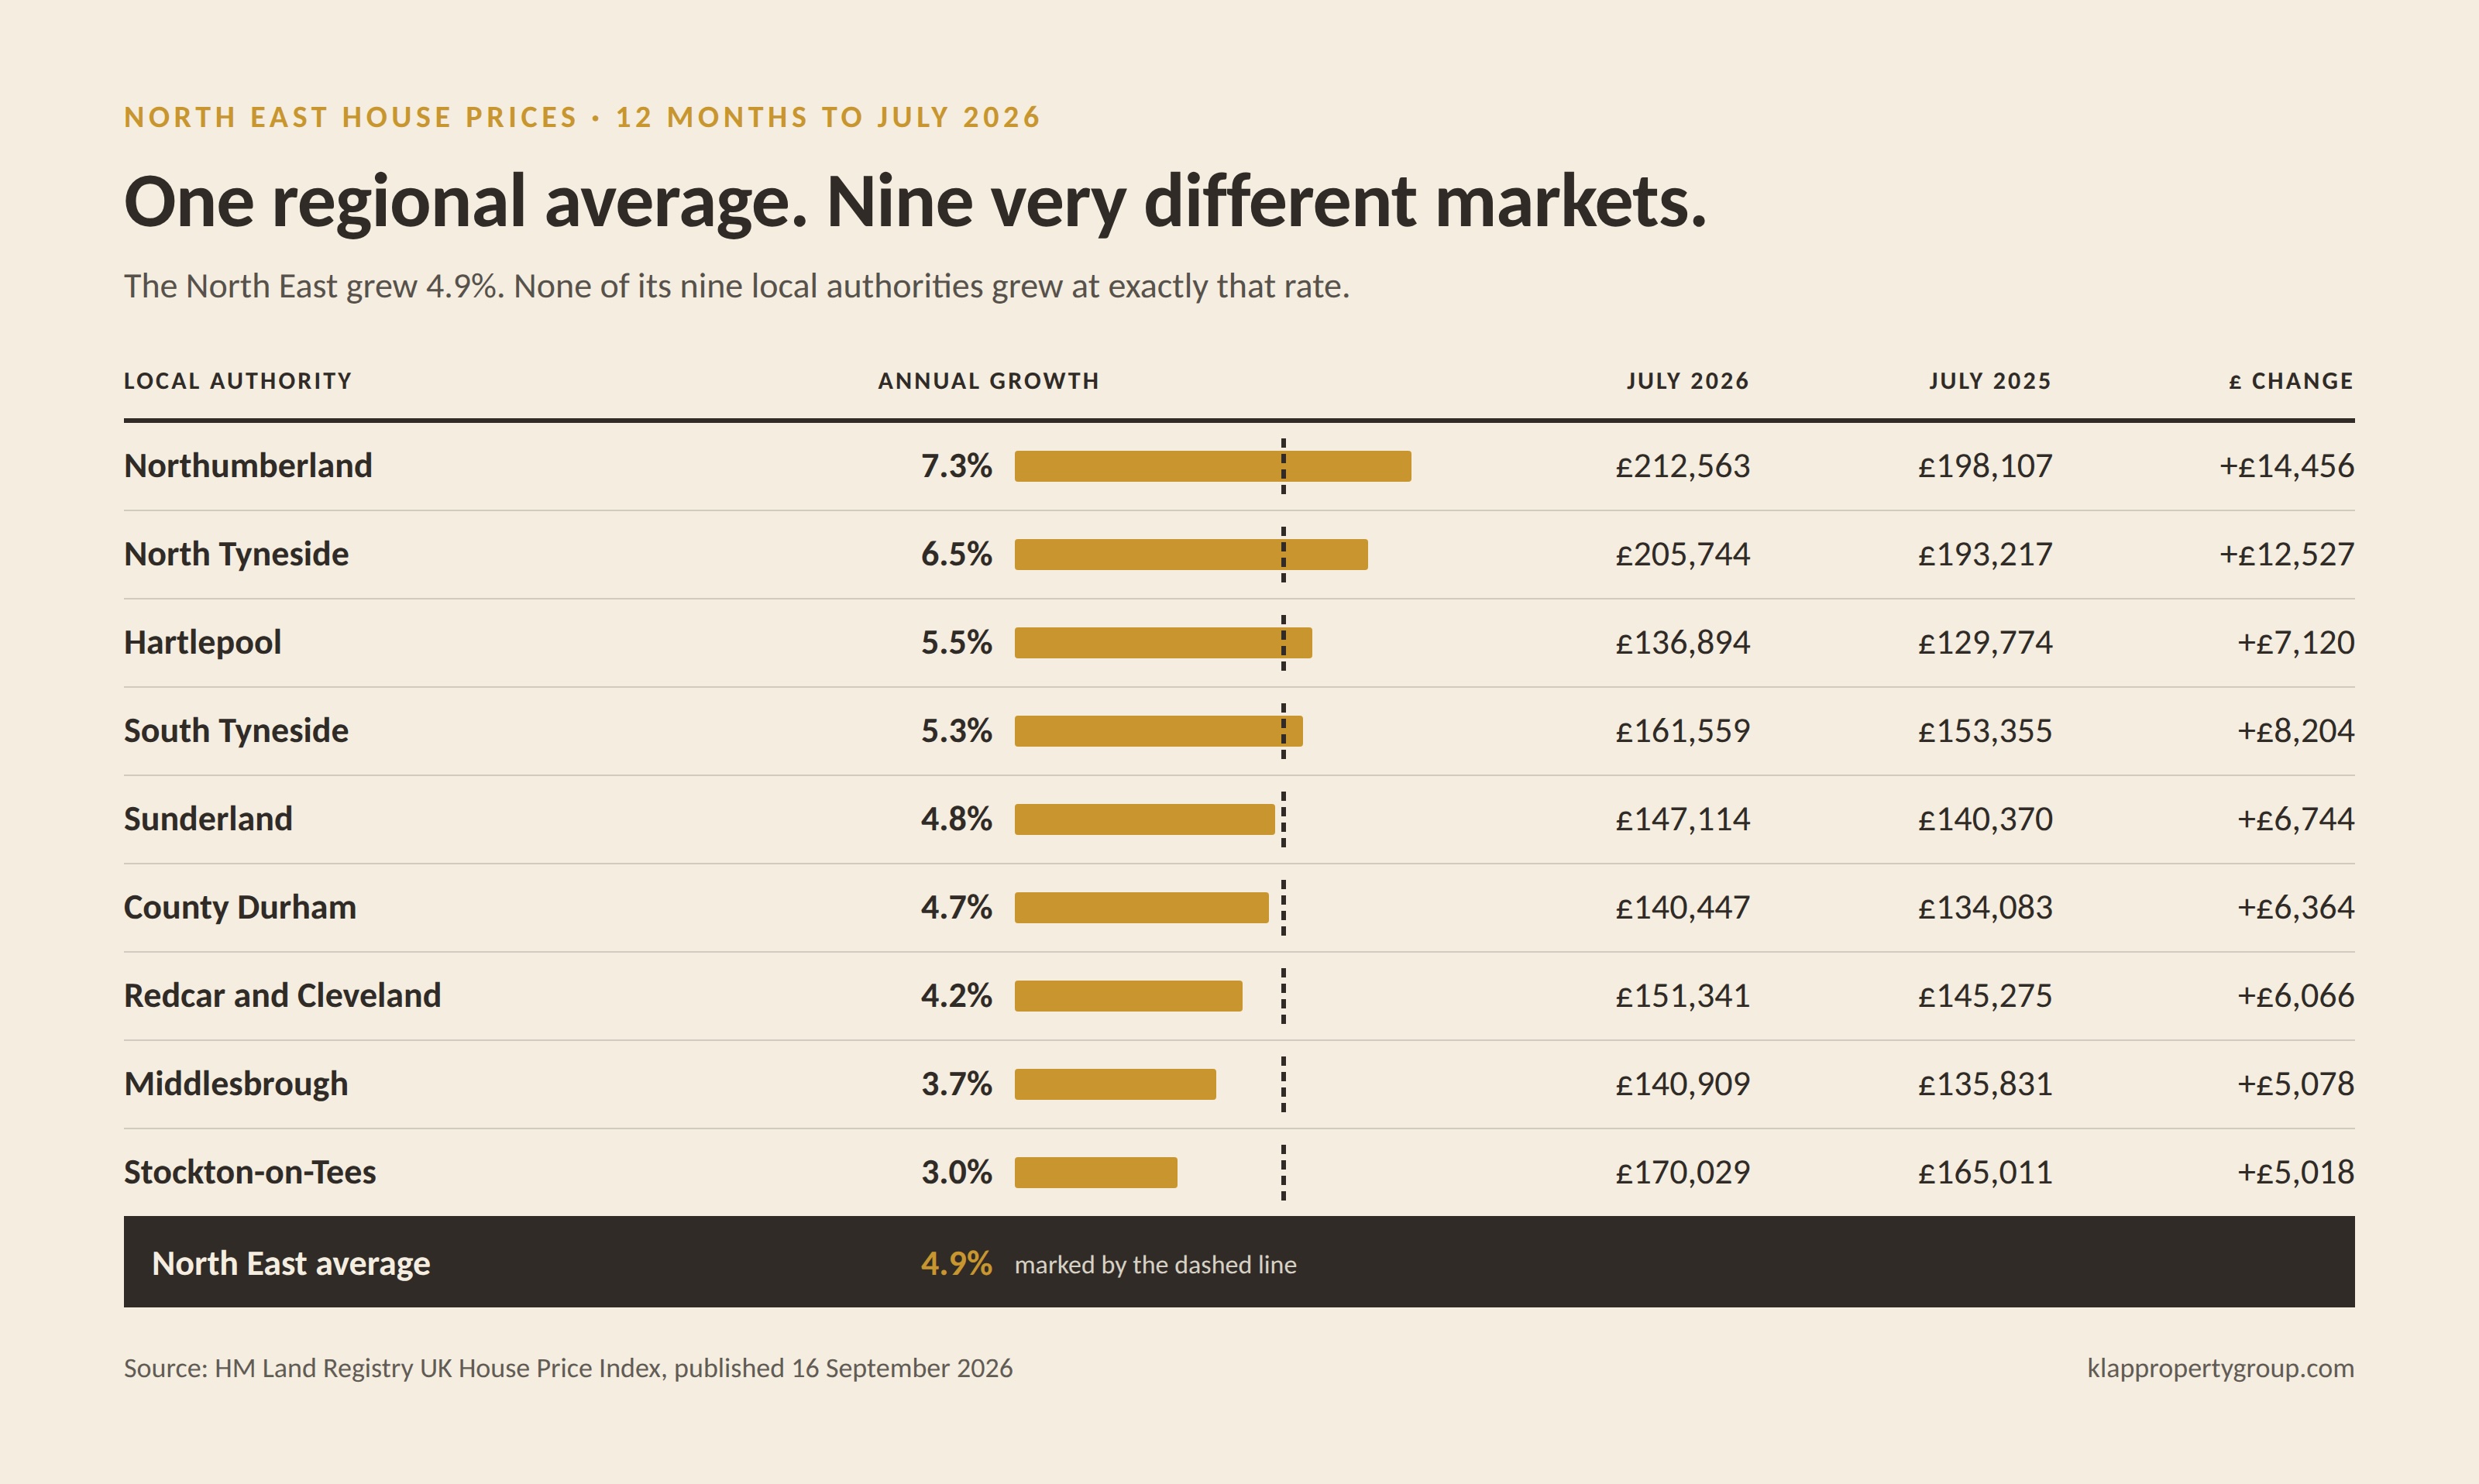
Look at the spread. Northumberland and Stockton both sit inside the same regional average of 4.9%, and both would be described, accurately, as "North East house prices up 4.9% this year" by anyone reading only the ONS press line. One of those local authorities is running hot. One is running at more than twice the annual growth rate of the other. We have called this stretch a corridor rather than a region since day one precisely because Blyth to Middlesbrough was never one market, and this week's data is as clean a proof of that as we have had all year.
The lowest rent in England, growing the fastest, and what that does and doesn't tell you
The other number worth sitting with is £788. That is the average North East rent in August, the lowest of any English region, against a national average of £1,400 and a London average of £2,332. It is genuinely worth noticing that the region recording the joint-fastest rent growth in the country is also the one starting from the lowest nominal base.
It is not, on its own, evidence of headroom. £788 sitting below £1,400 nationally or £2,332 in London tells you the distance between three numbers. It does not tell you how affordable £788 already is against a North East household's actual income, or how close local wages and benefit levels sit to that rent, and those are the things that would actually determine how much further rent can realistically climb before it starts pricing out the tenants paying it. The gap between North East and London rents is a fact about London and the North East. It is not a measurement of local affordability, and treating it as one is exactly the kind of manufactured precision that gets a strong data point undone on a second read.
What can honestly be said: strong percentage growth is being recorded here from a materially lower nominal rent base than almost anywhere else in England. That combination is worth watching precisely because it is unusual, not because it proves the room to keep running that it might intuitively suggest. Local incomes, benefit levels and household budgets are what would actually settle that question, and this release does not contain them.
Alex Upton, managing director for specialist mortgages and bridging finance at Hampshire Trust Bank, made the sharper point on the national data this month: rental growth "does not automatically mean stronger returns," and going forward "it is increasingly about owning the right properties rather than simply owning more of them." That line applies with more force in a region where the regional average is 4.9% but the range underneath it runs from 3.0% to 7.3%. Which of those nine numbers describes the property you are actually looking at is a more useful question than what the region did on average, and it is a question the regional headline cannot answer for you.
What might be sitting underneath the spread
ONS does not explain why Northumberland grew at 7.3% while Stockton grew at 3.0% in the same twelve months, that is not what the bulletin is for, and a single month of local authority data cannot isolate the cause on its own. Stock mix, transaction composition, base effects, local supply, mortgage affordability and plain statistical volatility can all move a local index by several points in a given month, and none of them require an infrastructure story to explain them.
Set against that, one hypothesis worth naming, because it is the one consistent with what we have been building our sourcing strategy around for two years, not a new claim invented to fit this month's numbers: the fastest-growing authorities in this data set also happen to be the ones carrying the clearest recent infrastructure and employment stories. Northumberland has had the Northumberland Line reopening reconnecting Bedlington and Ashington to the rail network, and the Cambois and Blyth sites earmarked for AI Growth Zone investment, both of which we covered as they developed. North Tyneside sits on the Tyne and Wear Metro network with connectivity that Stockton, further down the corridor, does not share in the same way. None of that is proof of causation from a single month's index movement, and it would be exactly the kind of manufactured precision this series avoids to claim it is. What can be said plainly is that the pattern in this month's numbers is consistent with that thesis. It does not confirm it.
What a nine-point spread inside one region actually means for underwriting
Three practical consequences follow from this, and none of them are complicated.
First, a regional average is not a substitute for a local authority figure, and a local authority figure is not a substitute for a street-level check. If a deal is being underwritten on the basis that "the North East is up 4.9%," ask which of the nine numbers above actually applies to the postcode in front of you, because none of the nine local authority figures above is actually 4.9%. The regional number is a blend nobody's property actually achieved.
Second, a slower-growing local authority in this data set is not automatically a weaker opportunity, and a faster-growing one is not automatically a better one. Fast organic growth in the index is not the same thing as a better BRRR opportunity, because the two are measuring different things: one is what the wider market did without you, the other is what a specific purchase, refurbishment and letting can do because of you. Stockton's 3.0% is the lowest figure in the corridor this month, and it is also where we have sourced some of our strongest recent BRRR conversions, on Bute Street among others, for reasons the Ezard Street example below sets out directly rather than by inference from this month's index alone.
Third, the regional rent figure hides the same problem the price figure does. The North East average is £788, up 5.8% annually to August, but that does not describe every local authority underneath it. North Tyneside's average rent was £857 in August, up 7.0% year on year. Newcastle upon Tyne was £1,215, up 9.3%. Middlesbrough was £698, up 4.0%. Redcar and Cleveland was £644, with rents broadly unchanged over the year. The regional rental figure is doing exactly what the regional house-price figure does: blending markets that are behaving very differently from each other. If you are underwriting rent from the 5.8% regional number rather than the actual local authority, postcode and comparable evidence, you are making the same mistake twice.
There is a fourth point worth adding, sitting alongside rather than explaining the rest of this piece. RICS's July survey, covered on this site three weeks ago, put UK landlord instructions at minus 27%, the sharpest fall in years, with members citing tax, regulation and affordability. That measures rental supply coming onto the market, not investor purchasing activity, and it is a national figure with no direct link established to this month's regional release. What can fairly be said is that rental supply remains constrained nationally at the same time as the North East is recording unusually strong rent and house price growth. Whether one is driving the other is not something either data set answers, and this piece is not going to claim otherwise.
A Stockton deal that never needed Northumberland's number
It is worth showing this rather than just asserting it. 1 Ezard Street, Stockton-on-Tees, which we sourced and refurbished as a four-bed HMO, sits in the same local authority that just posted the slowest price growth on the corridor, 3.0%. The purchase price was £47,000, with refurbishment of £43,999 including furniture, project management and contingency, against gross monthly rent of £1,650 and net monthly cashflow of approximately £806.
None of those figures depend on what Stockton's index does this year. The return comes from the price paid, the cost of the works, and the rent the four rooms actually achieve, which is precisely the BRRR mechanism we underwrite every deal against, and each of those three things is set at the point of purchase and refurbishment, not by the local authority's annual growth print. If Stockton's market had shown Northumberland's 7.3% instead of its actual 3.0% this year, this deal's monthly cashflow would not change, because it was never calculated from the index. That is the practical answer to the question this whole piece is really asking: does a slow-growth print in this month's data mean walk away from an area. On the evidence of our own recent sourcing, no. It means the growth in the ONS number and the return on the deal are two different things, measured two different ways, and only one of them was ever the plan for this property.
The National-to-Deal Chain
Here is the shape of the argument this piece has actually been making, laid out as a sequence rather than scattered across sections. National number: UK house prices up 1.4%, rents up 3.8%. Regional number: North East house prices up 4.9%, rents up 5.8%, both the highest or joint-highest in England. Local authority number: house price growth spreading from 3.0% in Stockton-on-Tees to 7.3% in Northumberland, and rent growth ranging from broadly unchanged in Redcar and Cleveland to 9.3% in Newcastle upon Tyne, both sitting inside the same two regional figures. Street: which side of those spreads the specific postcode in front of you actually sits on, a question none of the numbers above can answer. Deal: what the purchase price, the refurbishment cost and the achievable rent actually produce once the work is done, which is the only number in this whole chain that responds to what you do rather than what the market does.
The further down that chain you go, the closer the number gets to the asset you are actually buying. That is not a claim that national and regional conditions stop mattering, they still set the backdrop a deal has to survive, it is a claim about which number should decide whether a specific deal goes ahead. Each step down is also the one most people stop reading before they reach. The 4.9% headline is true. It also sits four steps away from the number that actually decides whether a specific deal works.
The part of this that is genuinely new information, not just restated
None of this is a call to distrust regional statistics generally. It is a specific, dated finding: on 16 September 2026, in the same release, the North East was named the fastest-growing region in England for house prices and joint-fastest for rents, while the underlying local authority data shows a 4.3 percentage point spread in house price growth and an even wider spread in rent growth between the corridor's slowest and fastest local authorities. That combination, a genuinely strong regional story sitting directly on top of genuinely large internal variation, is not something either the ONS bulletin's headline or a quick trade-press writeup of it is going to spell out for you. You have to open both documents and put them next to each other to see it, which is exactly what most people reading the 4.9% figure this week will not do.
What to do with this before the next release lands
The next UK HPI update lands 21 October, the next ONS rent and price bulletin a similar window later. Between now and then, the practical use of this month's numbers is narrow and specific: stop citing "North East house prices" as though it describes one market, and start asking, for any deal on the table, which of the nine corridor figures above it actually sits closest to, and whether the case for the deal survives being tested against that number rather than the regional one. A deal that only works if you assume Northumberland-level growth, priced in a town running at Stockton's pace, is a deal built on the wrong number. A deal that works on Stockton's more modest pace, with the return coming from the refurbishment and the letting rather than the market doing the work, is the more resilient version of the same opportunity, and it is the version we have been built around from the start.
Key takeaways
National. UK house prices up 1.4% (12 months to July), rents up 3.8% (12 months to August). ONS, 16 September 2026.
Regional. North East: highest house price growth of any English region at 4.9%, joint-highest rent growth at 5.8%, lowest average rent in England at £788.
The spread. Corridor local authority growth ranges from 3.0% (Stockton-on-Tees) to 7.3% (Northumberland), a 4.3 point spread inside one regional average.
The trap. A regional average describes a blend, not a market. None of the nine local authority figures is actually 4.9%. Ask which one a specific deal is closer to before underwriting off the region.
The rent caveat. Lowest rent in England plus joint-highest rent growth is unusual and worth watching. It is not evenly spread either, North Tyneside and Newcastle are up 7.0% and 9.3%, Redcar and Cleveland is broadly unchanged, and it is not proof of affordability headroom, that depends on local incomes and benefit levels, not measured here.
The chain. National, regional, local authority, street, deal. The further down it you go, the closer the number gets to the asset you are actually buying, and it is the one most readers stop before reaching.
The evidence. 1 Ezard Street, Stockton, sits in the corridor's slowest-growing authority and still nets approximately £806 a month, because the return comes from the purchase price, the works and the rent, not the index.
Takeaway
The region we operate in just topped two national tables in the same week, and almost nobody will read past the first number to see how unevenly that growth actually landed. The nine local authorities across the corridor are not having the same year. Knowing which one your deal is actually in is worth more than knowing what the region did on average.
If you want to talk through what the current numbers mean for a specific corridor town or a deal you're looking at, get in touch.
Keeshan | KLAP Property Group klappropertygroup.com
Sources
Private rent and house prices, UK: September 2026, Office for National Statistics, released 16 September 2026: https://www.ons.gov.uk/economy/inflationandpriceindices/bulletins/privaterentandhousepricesuk/september2026
UK House Price Index England: July 2026, HM Land Registry, published 16 September 2026: https://www.gov.uk/government/statistics/uk-house-price-index-for-july-2026/uk-house-price-index-england-july-2026
House price growth falls but rents on rise, Property Investor Today, 17 September 2026 (Alex Upton, Hampshire Trust Bank, quoted): https://www.propertyinvestortoday.co.uk/breaking-news/2026/09/house-price-growth-falls-but-rents-on-rise/
ONS local authority private rent data (Price Index of Private Rents), "Housing prices in your area", updated 16 September 2026, twelve months to August 2026: https://www.ons.gov.uk/visualisations/housingpriceslocal/landing