
Rents Are Beating Prices in 9 of 12 North East Councils. Hartlepool Runs Furthest the Other Way.

In Hartlepool, terraced prices rose 8.0% in a year while terraced rents rose only 2.8%. In 9 of the 12 North East councils we track, terraced rents rose faster than terraced prices. Newcastle is level, and Hartlepool is the wider of the two that run the other way. North Tyneside shows rents up 5.9% against prices up 2.3%. We show the gap for all twelve councils and a three-step Rent Gap Check, the town level of our Three-Level Check, to test your own. The figures are ONS data and do not say why any council moves as it does.
In Hartlepool, terraced prices rose 8.0% in the year to September 2026, while terraced rents rose only 2.8% in the year to October 2026. In 9 of the 12 North East councils we track, terraced rents rose faster than terraced prices. Newcastle is level. Hartlepool is the wider of the two that run the other way, and these ONS figures are not a forecast.
Why does rent growth matter more now?
Bank Rate rose to 4% on 5 November, as we covered in Four Numbers That Changed in the Corridor This Month. When borrowing costs more, the rent side of your sums has less room to be wrong. Every council below is one of the 12 North East councils we track.
How do you compare rents with prices?
Subtract the year's change in terraced price from the year's change in terraced rent. That is the gap, in percentage points. A positive gap points to a higher gross yield than a year ago, on these averages. A negative gap points to a lower one.
ONS released these figures on 18 November 2026, and every council figure comes from the ONS local housing pages linked below, read that day. ONS marks the house price data provisional. The local rent figures carry no such label. The rent figures come from the ONS Price Index of Private Rents and the price figures from the UK House Price Index, two different measures, so treat the gap as a pointer. The figures do not say why any council moves, and we will not guess.
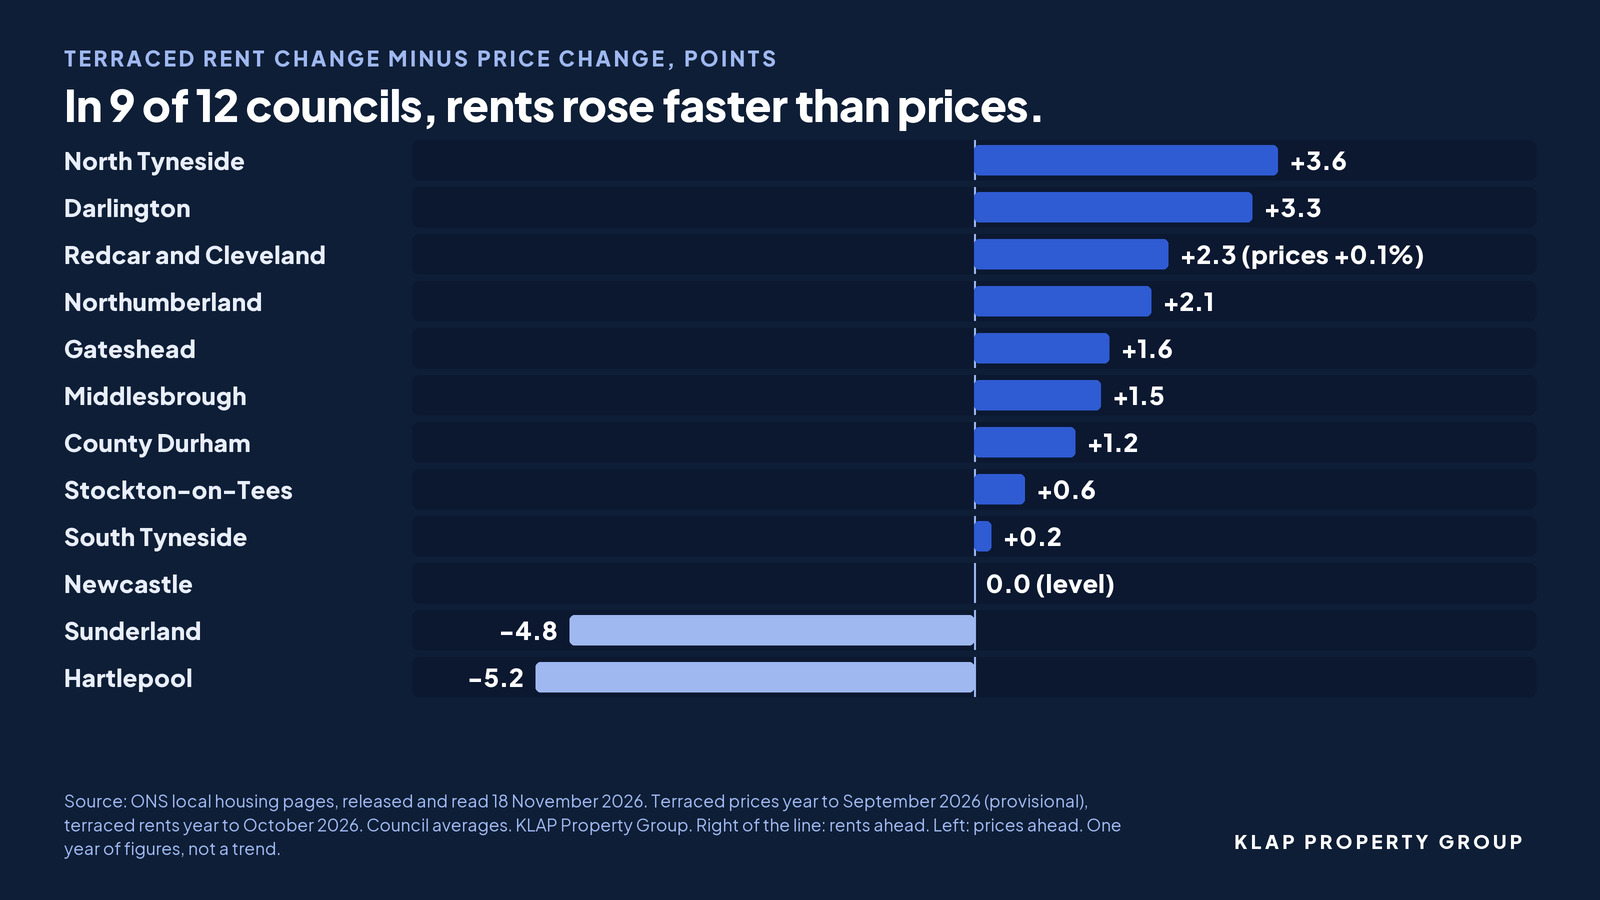
North Tyneside: prices +2.3%, rents +5.9%, gap +3.6 points
Darlington: prices +3.2%, rents +6.5%, gap +3.3 points
Redcar and Cleveland: prices +0.1%, rents +2.4%, gap +2.3 points
Northumberland: prices +4.7%, rents +6.8%, gap +2.1 points
Gateshead: prices +3.9%, rents +5.5%, gap +1.6 points
Middlesbrough: prices +2.4%, rents +3.9%, gap +1.5 points
County Durham: prices +5.4%, rents +6.6%, gap +1.2 points
Stockton-on-Tees: prices +2.7%, rents +3.3%, gap +0.6 points
South Tyneside: prices +6.9%, rents +7.1%, gap +0.2 points
Newcastle: prices +6.0%, rents +6.0%, gap 0.0 points (level)
Sunderland: prices +8.9%, rents +4.1%, gap -4.8 points
Hartlepool: prices +8.0%, rents +2.8%, gap -5.2 points
Which councils have rents racing ahead?
Four councils have rents well ahead: North Tyneside (3.6 points), Darlington (3.3), Redcar and Cleveland (2.3) and Northumberland (2.1). In North Tyneside, terraced rents rose 5.9% against prices up 2.3%.
Redcar and Cleveland gets there differently: prices barely moved, up 0.1%, and its 2.4% rent rise is the slowest of the twelve.
Three more have rents one to two points ahead: Gateshead (1.6), Middlesbrough (1.5) and County Durham (1.2).
Which councils are close to level?
Three councils sit less than a point from level. Rents are slightly ahead in Stockton-on-Tees (0.6) and South Tyneside (0.2). Newcastle is level, with rents and prices both up 6.0%. A gap that small tells you little about the yield, so your own street's rent decides the deal. Newcastle's figure includes a city rental market, with the highest average terraced rent of the twelve at £1,304 a month.
Where are prices ahead of rents?
Two councils run this way, both by a wide margin. Sunderland is 4.8 points behind: prices rose 8.9%, the fastest of the twelve, and rents 4.1%. Hartlepool is 5.2 points behind, the widest gap of the twelve. Where the gap is negative, justify your offer with today's rent, not last year's price rise. Hartlepool's price rise is the second fastest of the twelve, yet its rent has not kept pace. For the yield, a price rise holds it steady only if the rent keeps pace, and the figures do not say why it has not.
What is the Rent Gap Check?
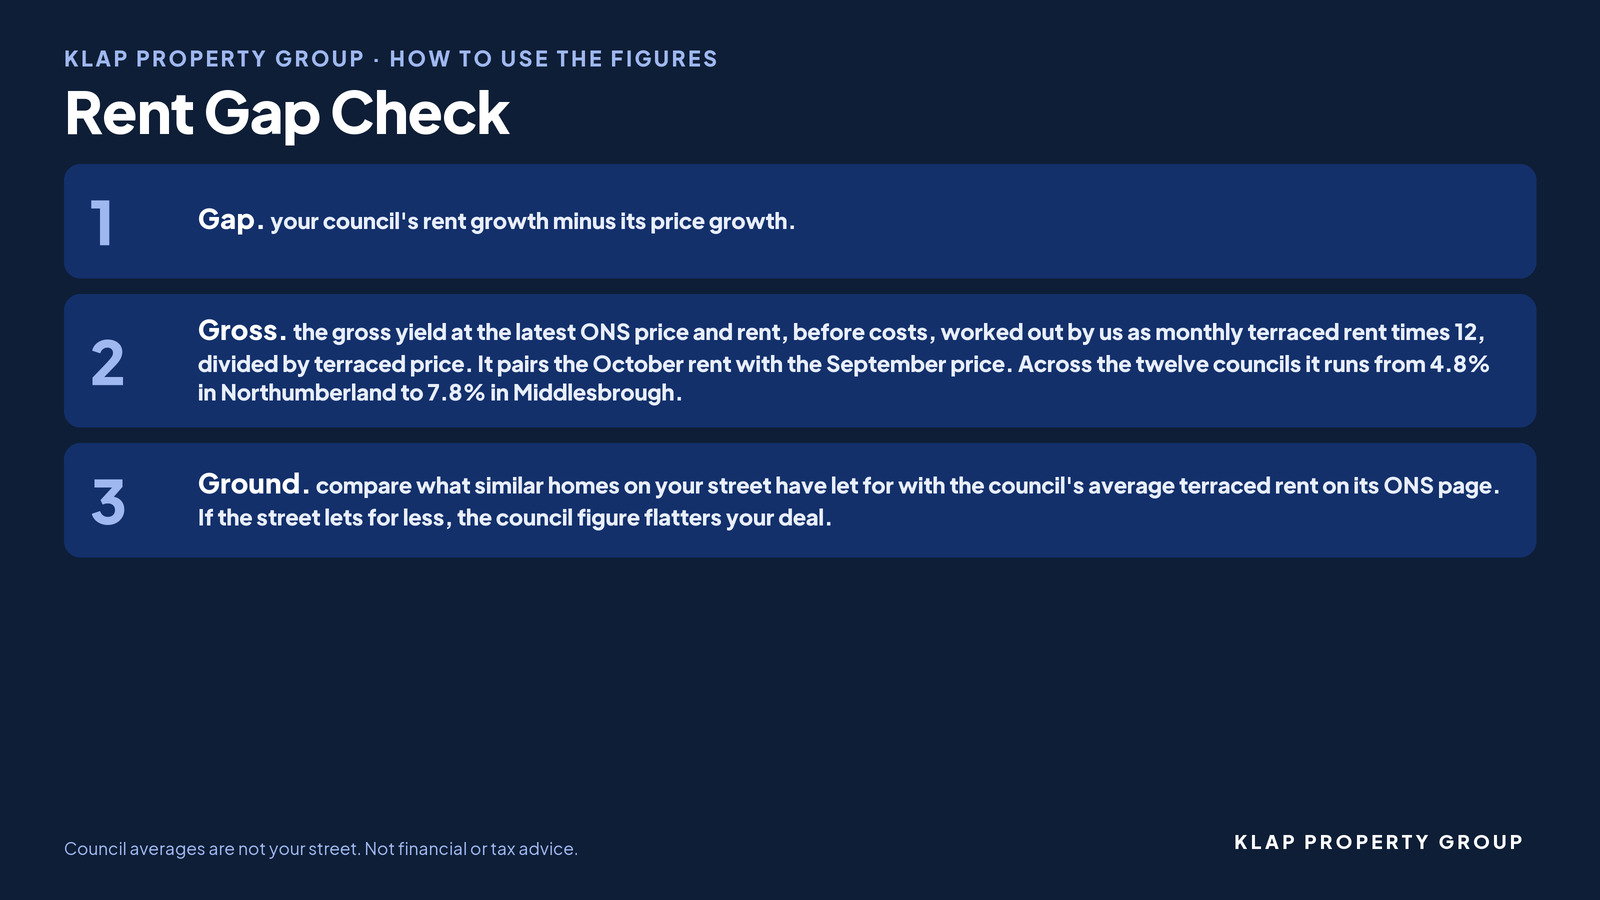
The Rent Gap Check is the town level of our Three-Level Check (region, town, street) from the 29 October blog. It hands over to the Street Check, which sets out Sold, Let, Rated, Ruled.
Gap: your council's rent growth minus its price growth.
Gross: the gross yield at the latest ONS price and rent, before costs, worked out by us as monthly terraced rent times 12, divided by terraced price. It pairs the October rent with the September price. Across the twelve councils it runs from 4.8% in Northumberland to 7.8% in Middlesbrough.
Ground: compare what similar homes on your street have let for with the council's average terraced rent on its ONS page. If the street lets for less, the council figure flatters your deal.
Checks before you buy
Find your council's gap in the list above.
Work out the gross yield at the price you would actually pay, before costs, and price the rent you can evidence, not the one you hope for.
Stress-test at a current buy-to-let mortgage rate you can see today, then at a higher one of your choosing, and keep your walk-away number.
Which way is your town going? A council average hides the town and the street. Book a call and we will go through the rent and price for the town and street you are looking at.
KLAP runs refurb builds for investors in the Blyth to Middlesbrough corridor, and the deals we source feed those builds.
Property values and rents can go down as well as up. This is not financial or tax advice.
KLAP Property Group
klappropertygroup.com
Sources
ONS local house prices and rents: Hartlepool: https://www.ons.gov.uk/visualisations/housingpriceslocal/E06000001/
ONS local house prices and rents: South Tyneside: https://www.ons.gov.uk/visualisations/housingpriceslocal/E08000023/
ONS local house prices and rents: Darlington: https://www.ons.gov.uk/visualisations/housingpriceslocal/E06000005/
ONS local house prices and rents: Redcar and Cleveland: https://www.ons.gov.uk/visualisations/housingpriceslocal/E06000003/
ONS local house prices and rents: Northumberland: https://www.ons.gov.uk/visualisations/housingpriceslocal/E06000057/
ONS local house prices and rents: North Tyneside: https://www.ons.gov.uk/visualisations/housingpriceslocal/E08000022/
ONS local house prices and rents: County Durham: https://www.ons.gov.uk/visualisations/housingpriceslocal/E06000047/
ONS local house prices and rents: Newcastle: https://www.ons.gov.uk/visualisations/housingpriceslocal/E08000021/
ONS local house prices and rents: Gateshead: https://www.ons.gov.uk/visualisations/housingpriceslocal/E08000037/
ONS local house prices and rents: Middlesbrough: https://www.ons.gov.uk/visualisations/housingpriceslocal/E06000002/
ONS local house prices and rents: Stockton-on-Tees: https://www.ons.gov.uk/visualisations/housingpriceslocal/E06000004/
ONS local house prices and rents: Sunderland: https://www.ons.gov.uk/visualisations/housingpriceslocal/E08000024/
Bank of England Monetary Policy Summary, November 2026: https://www.bankofengland.co.uk/monetary-policy-summary-and-minutes/2026/november-2026
KLAP: Four Numbers That Changed in the Corridor This Month: https://www.klappropertygroup.com/blogs/interest-rate-rise-buy-to-let-north-east-november-2026
KLAP: Same Town, Two Postcodes, Two Different Deals: https://www.klappropertygroup.com/blogs/hartlepool-house-prices-by-postcode-ts24-ts25-october-2026